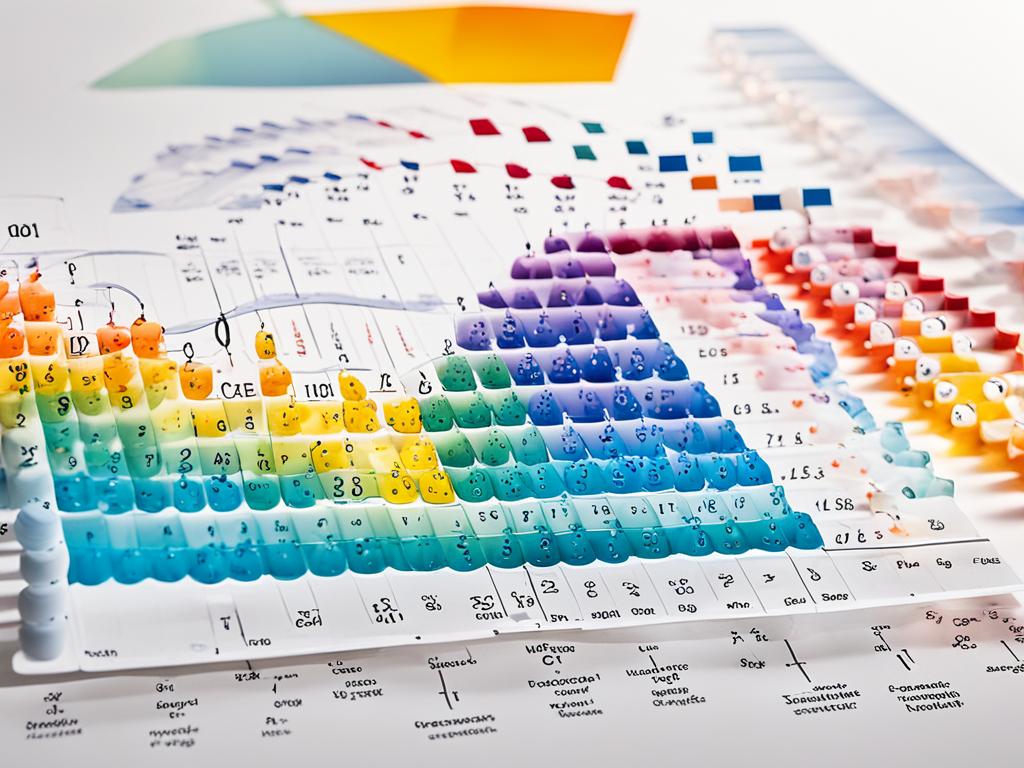
The periodic table organizes all elements by their atomic number and properties. Periodic trends show patterns in these properties. They include aspects like electronegativity and electron affinity. These patterns help chemists predict how elements will react.
This article looks into some key periodic trends. These include ionization energy and atomic radius. By studying these trends, we can better understand the periodic table. We see how elements behave based on their positions and properties.
Key Takeaways
- The periodic table is a tool for organizing and understanding the properties of elements.
- Periodic trends, such as electronegativity, ionization energy, and atomic radius, provide valuable insights into the behavior of elements.
- Understanding these trends is crucial for predicting and explaining chemical reactions, bonding, and the properties of substances.
- Factors like electron configuration, nuclear charge, and atomic size influence the observed periodic trends.
- Recognizing and applying periodic trends is essential for chemists to gain a deeper understanding of the fundamental principles governing the elements.
Introduction to Periodic Trends
The periodic table arranges elements by their atomic number and properties. It shows periodic trends. These trends reveal how the elements’ characteristics change across the table. This helps us understand each element’s nature and behavior.
What are Periodic Trends?
Periodic trends are the changes in elements’ properties on the periodic table. They happen because of similar electron structures and increasing atomic numbers. Knowing these patterns lets us guess and explain elements’ traits. These include electronegativity, ionization energy, and more.
Importance of Periodic Trends in Chemistry
Understanding the periodic trends is key for chemists. It helps them predict how elements will act. This is important for predicting reactions, understanding bonding, and more. This knowledge is critical across chemistry, from the basics to complex areas like materials science.
Electronegativity Trends
Electronegativity shows how much an atom likes to attract and keep electrons. It’s measured on the Pauling scale. You can find these values on specific periodic tables.
Trend Across a Period
As you move across a period, electronegativity goes up. Atoms get easier access to more electrons. This happens because the number of protons increases.
Trend Down a Group
Going down a group, electronegativity goes down too. It’s because the atoms get bigger. This change makes it harder for them to attract more electrons. Special elements like noble gases, lanthanides, and actinides don’t follow this rule strictly.
Ionization Energy Trends
Ionization energy is the energy needed to take an electron from a neutral gas atom. It’s the opposite of electronegativity. If an atom’s ionization energy is low, it can easily lose an electron and become a cation.
Trend Across a Period
Across a periodic table period, ionization energy goes up. This happens because the valence shell gets more stable. Atoms get smaller, binding valence electrons closer to the nucleus.
Trend Down a Group
Down a group, ionization energy drops. This is thanks to electron shielding. Inner electrons shield outer ones from the nucleus. So, it’s easier to remove that first outer electron.
Factors Affecting Ionization Energy
A few things influence ionization energy, like the principal quantum number (n) and effective nuclear charge (Zeff). For noble gases, it’s tough to remove their electrons. They have the highest ionization energies because their valence shells are full, making them very stable.

Electron Affinity Trends
Electron affinity measures how much energy changes when an atom gets an extra electron. Unlike electronegativity, it comes with a number value. As you move from left to right on the periodic table, electron affinity usually goes up. This is because atoms are smaller, so the new electron is closer to the nucleus. Down a group, the increase in size means electron affinity drops.
Noble gases and certain other elements break the usual electron affinity rules. For example, adding an electron to these atoms usually makes energy. But, adding a second electron to some makes it use energy and gets a positive value instead.
| Element | Electron Affinity (kJ/mol) |
|---|---|
| Lithium (Li) | -60 |
| Sodium (Na) | -53 |
| Potassium (K) | -48 |
| Rubidium (Rb) | -47 |
| Cesium (Cs) | -46 |
| Fluorine (F) | -328 |
| Chlorine (Cl) | -349 |
| Bromine (Br) | -324 |
| Iodine (I) | -295 |
Across the periodic table, nonmetals usually have a stronger pull for new electrons. This is because of their structure and need to complete their outer shells. As you go up and to the right, adding electrons becomes more attractive. But, going down and to the left, it’s less so.
Fluorine’s pull is strong, even though it’s on the right side. It’s an exception due to its dense electron cloud, which sometimes fights the pull towards the nucleus. Apart from that, the regular trend follows. The attraction increases from left to right but decreases as you go down the table. This is due to the growing size of atoms.
Atomic Radius Trends
What is Atomic Radius?
Atomic radius is how far the nucleus is from the outer shell of an atom. It’s usually measured in picometers. Knowing this helps us understand the patterns and behavior of elements.
Trend Across a Period
As you go across a row on the periodic table, the atomic radius gets smaller. This is because the nuclear charge increases. It pulls valence electrons closer in, so atoms don’t spread out as much.
Trend Down a Group
Heading down a group on the periodic table, the atomic radius grows. More electron shells make the atom bigger. Valence electrons are further from the nucleus, making the atom look larger overall.
The noble gases kind of break these rules. Their atomic radii are bigger than the halogens before them. This is because they have different atomic radius measurements (van der Waals radius for noble gases and covalent radius for the rest).
Periodic Table Trends: Understanding Element Properties
The periodic table trends give us key insights into elements. They help us understand the patterns in the periodic table. This knowledge lets chemists and students alike predict and explain elements‘ characteristics such as size, reactivity, and physical properties. These patterns are due to how elements are organized by atomic number. This leads to similar behavior among elements in groups and rows.
Applying these periodic table trends is vital. It helps in understanding chemical bonding, predicting reactions, and explaining elements and their compounds’ properties.
Metallic Character Trends
Metallic character shows if an element acts like a metal. It includes being good at conducting electricity and heat. Metals are also shiny and bendable. As we move from left to right on the periodic table, the metallic character of the elements decreases. They become more likely to hold on to their electrons. This makes them less metal-like.
On the other hand, moving down a group in the periodic table means more metallic behavior. These elements are eager to give away electrons and form positive ions. They increase in size and become better metals as you go down. This is because their ionization energy drops and their atomic radius rises.
Metallic Properties Across a Period
When you look at a period from left to right, the metallic character goes down. The elements’ electronegativity rises, so they don’t want to lose electrons. This change makes them act less like metals. Instead, they show more properties of nonmetals.
Metallic Properties Down a Group
Going down a group, though, increases metallic character. Elements at the bottom are big and have low ionization energy. This makes them eager to lose electrons and act like metals. The alkali metals and alkaline earth metals at the bottom show the most metallic behavior in the periodic table.
Melting and Boiling Point Trends
Elements melt and boil at different points because of how closely their atoms or molecules hold together. Going across the periodic table, melting and boiling points of metals drop as you move right. That’s because they lose metal-like qualities. This makes the forces between them weaker. However, for nonmetals, their melting and boiling points rise as you move right. This is because their forces get stronger.
Melting Point Trends
Moving down the periodic table, metals melt at lower points as they become more metal-like. Their forces weaken. The trend flips for nonmetals. Their melting points climb as they strengthen their forces. Element melting points can span from -272°C for Helium to 3500°C for solid Carbon.
Boiling Point Trends
The story is similar for boiling points. Metals‘ boiling points go down the group, while nonmetals‘ go up. Hydrogen, a nonmetal, has the lowest boiling point at -253°C. Tantalum, a metal, hits as high as 5425°C.
These trends help us see the melting and boiling points based on the size of atoms and their bonds.
Valence Electron and Valency Trends
The periodic table shows clear patterns in valence electrons and valency of elements. These trends help us understand how elements will react chemically. This knowledge is key to predicting an element’s behavior when it mixes with others.
Valence Electrons Across a Period
Across a period on the periodic table, the number of valence electrons goes up. This happens because the elements have higher atomic numbers. More electrons in the outermost shell means more reactivity.
Valence Electrons Down a Group
Moving down a group, the number of valence electrons stays the same. Elements in the group share a common valence electron configuration. The configuration is based on the group number.
Valency Trends
Valency increases then decreases across a period. It peaks in the middle. For a group, valency remains constant. This is because group members share the same valence electron configuration.

| Group | Valence Electrons | Valency Examples |
|---|---|---|
| 1 | 1 | Hydrogen (H): 1 |
| 2 | 2 | Beryllium (Be): 2 |
| 13 | 3 | Aluminium (Al): 3 |
| 14 | 4 | Carbon (C): 4 |
| 15 | 5 | Nitrogen (N): 3 |
| 16 | 6 | Oxygen (O): 2 |
| 17 | 7 | Fluorine (F): 1 |
| 18 | 8 | Neon (Ne): 0 |
Reactivity Trends
Reactivity shows how likely an element is to join a chemical reaction. Elements in the periodic table follow clear patterns. These patterns tell us a lot about how they act and their properties.
Reactivity of Metals
Moving across a period, metal reactivity drops. This happens from left to right. Elements lose their ability to give away electrons and create positive ions. It’s because their metallic traits lessen.
The trend is linked to ionization energy rising in this same direction. Ionization energy refers to the energy needed to remove an electron from an atom.
Reactivity of Nonmetals
On the flip side, nonmetals get more reactive from left to right. That’s because they prefer to take electrons. By doing so, they become negative ions. Their craving for electrons goes up due to higher electronegativity.
Electronegativity is about how much an atom wants to attract and keep electrons. This property grows as elements go to the right across the table.
Going down a group, metal reactivity spikes. This is because their metallic nature and electropositivity increase. In contrast, nonmetal reactivity drops. It’s because their desire to gain electrons lessens. These trends match the changes seen in ionization energy and electron affinity when going down a group.
Source Links
- https://chem.libretexts.org/Bookshelves/Inorganic_Chemistry/Supplemental_Modules_and_Websites_(Inorganic_Chemistry)/Descriptive_Chemistry/Periodic_Trends_of_Elemental_Properties
- https://chemistrytalk.org/periodic-trends-made-easy/
- https://www.geeksforgeeks.org/periodic-table-trends/
- https://pressbooks.pub/gschemistry/chapter/periodic-trends/
- https://chemistrytalk.org/electronegativity-chart-trends/
- https://www.compoundchem.com/2014/02/12/periodicity-trends-in-the-periodic-table/
- https://chem.libretexts.org/Bookshelves/Inorganic_Chemistry/Supplemental_Modules_and_Websites_(Inorganic_Chemistry)/Descriptive_Chemistry/Periodic_Trends_of_Elemental_Properties/Periodic_Trends
- https://www.thoughtco.com/ionization-energy-and-trend-604538
- https://chemistrytalk.org/what-is-electron-affinity/
- https://chem.libretexts.org/Bookshelves/Physical_and_Theoretical_Chemistry_Textbook_Maps/Supplemental_Modules_(Physical_and_Theoretical_Chemistry)/Physical_Properties_of_Matter/Atomic_and_Molecular_Properties/Electron_Affinity
- https://byjus.com/chemistry/electron-affinity/
- https://chem.libretexts.org/Bookshelves/Introductory_Chemistry/Introductory_Chemistry_(CK-12)/06:_The_Periodic_Table/6.15:_Periodic_Trends-_Atomic_Radius
- https://ecampusontario.pressbooks.pub/enhancedchemistry/chapter/atomic-properties/
- https://www.thoughtco.com/metallic-character-periodic-table-trends-608790
- https://chem.libretexts.org/Bookshelves/Introductory_Chemistry/Introductory_Chemistry_(CK-12)/06:_The_Periodic_Table/6.22:_Periodic_Trends_-_Metallic_and_Nonmetallic_Character
- https://sciencenotes.org/metallic-character-trend-on-the-periodic-table/
- https://byjus.com/chemistry/trends-in-periodic-properties/
- https://chem.libretexts.org/Bookshelves/Introductory_Chemistry/Introduction_to_General_Chemistry_(Malik)/02:_Elements/2.06:_The_periodic_trends_in_properties_of_the_elements
- https://accessdl.state.al.us/AventaCourses/access_courses/physci_ua_v17/02_unit/02-02/02-02_learn_valence_alt.htm
- https://byjus.com/chemistry/periodicity-of-valence-or-oxidation-states-of-elements/
- https://byjus.com/chemistry/modern-periodic-table-trend/


